This project was conceived due to a series of necessities: The necessity to properly manage my own finances, understand my expenses, improve my relationship with my both wallet and PowerApps and starting to post things on my Blog. I haven't quite had it figured yet what is it that I will be using this Blog for, however and having used PowerApps for a while now for my own personal purposes, figured that making the projects I have developed available for others would be a great start, with the hopes they can help you as much as they have myself =).
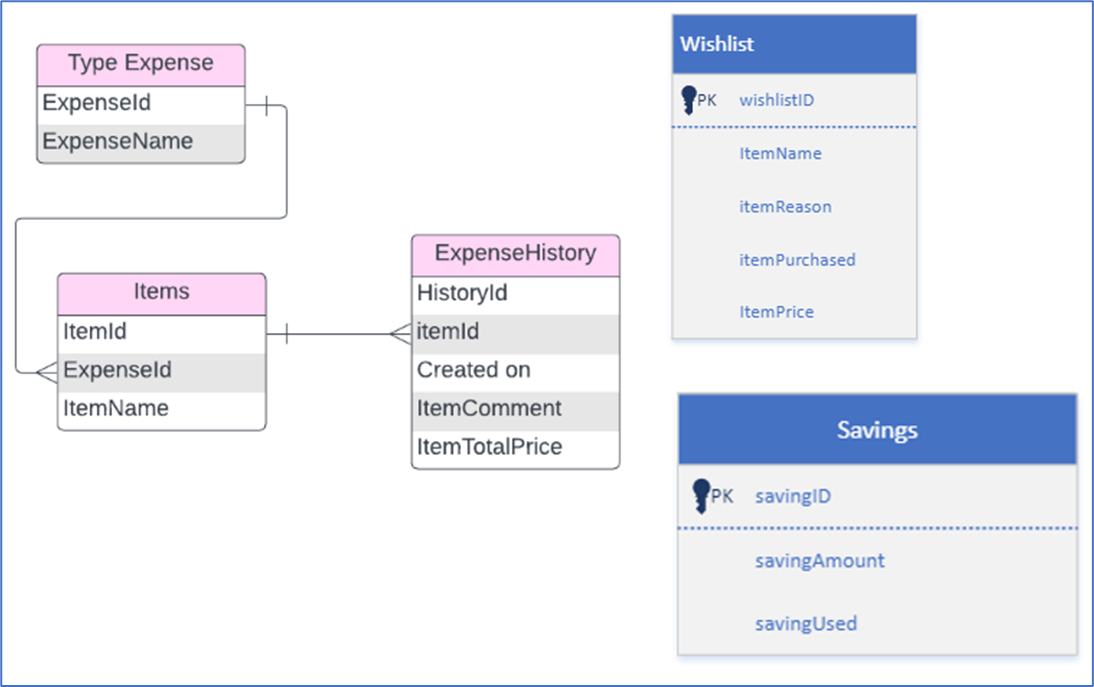
Entity-relationship diagram
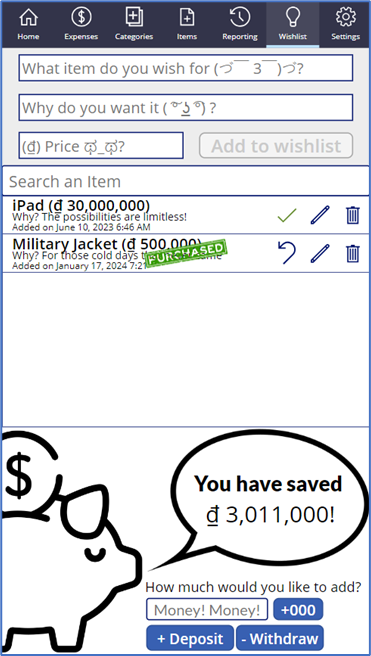
Functionalities
The Canvas app is composed of 7 different screens:
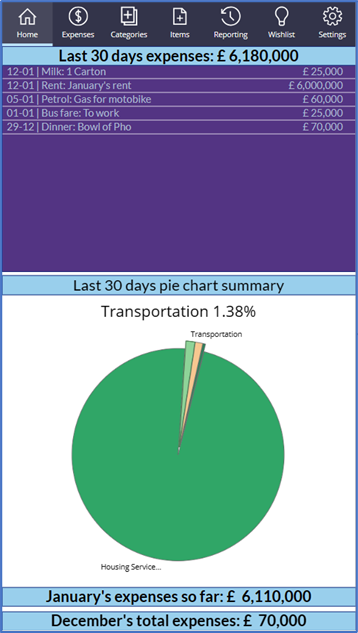
Home screen
The first screen of the app. Kind of a "read-only" screen it shows your expenses for the last 30 days, along with Previous and ongoing months expenses. Additionally, it contains a pie chart containing the percentage of these expenses based on Category.
Categories screen
Screen for creating Categories. A Category is a grouping of related costs, such as Housing and services, transportation, groceries, etc.
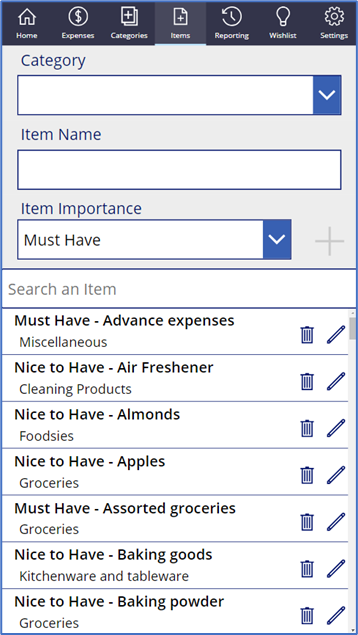
Items screen
This screen allows you to add Items to every Category you created in the previous screen along with its perceived importance. For instance, Apples would be an item for Groceries.
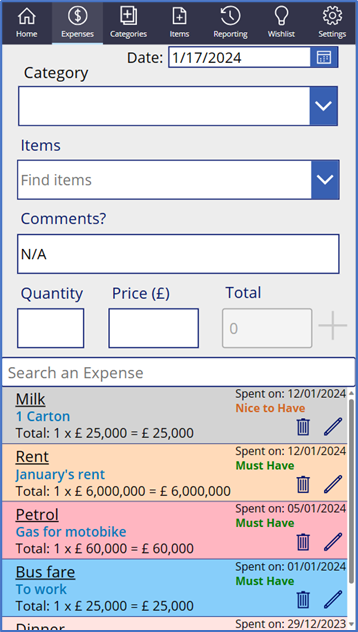
Expenses screen
Here is where your record all your expenses, indicating Category, Item, comments, quantities and prices.
Reporting Reporting screen
This screen allows you both to generate an expense report [Sent to your email] within a specific range or compare the expenses of 2 different months. It also contains a line chart describing your Expense trend.
Wishlist Screen
This screen allows you to record items you’d like to buy, mark them as purchased and keep track of your savings: I use a piggy bank and, every time I deposit money in it, I record it in this screen.
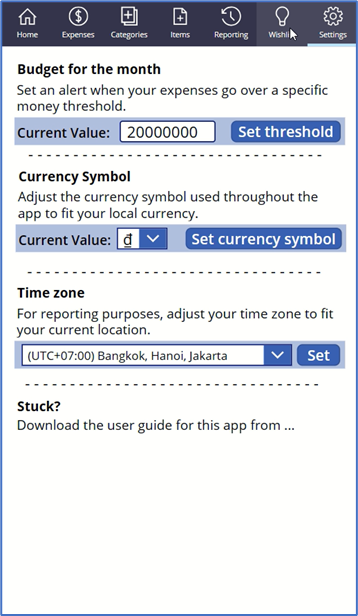
Settings screen
Here you can set a budget for monthly expenses, change your currency symbol and set your time zone: Dataverse records are saved as UTC, hence, to ensure an accurate report of your expenses, you need to set your time zone properly.
Import Solution
Once you download and import the solution, make sure to create and select the appropriate connections:
And the solution should install successfully:
Import default data
The next step should be to make sure and import the initial values for the SettingsExpenses table using the cr849_settingsexpenseses.csv you downloaded before along with the solution package:

This step should populate the table:
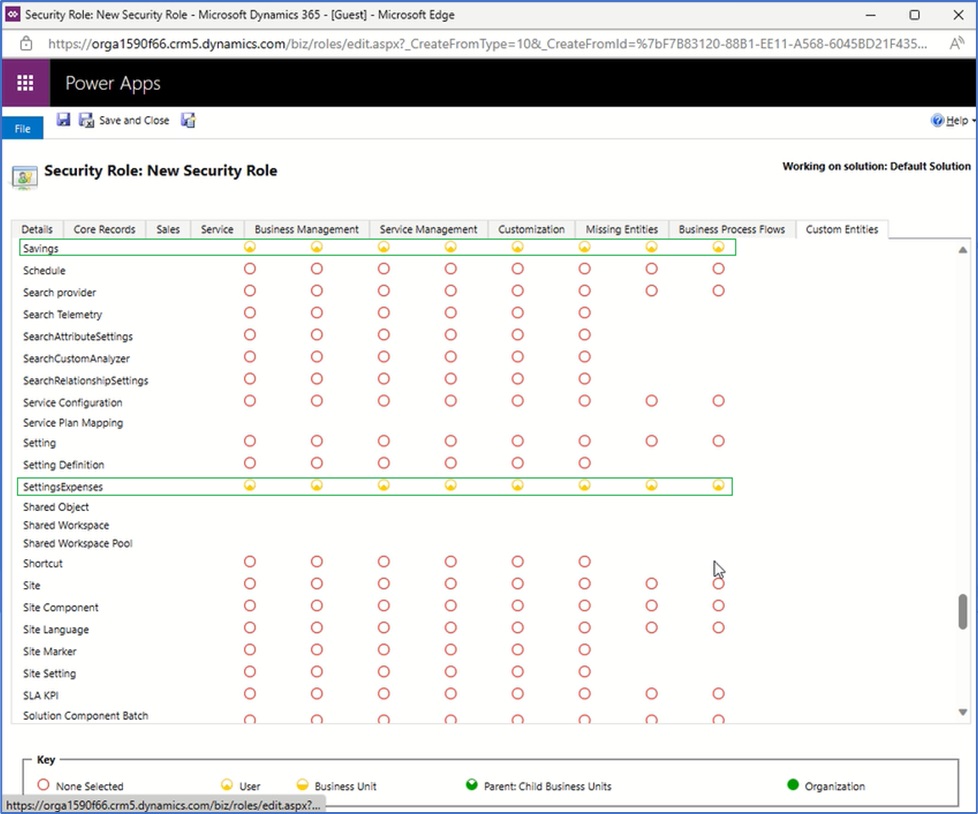
Create Custom role and share app
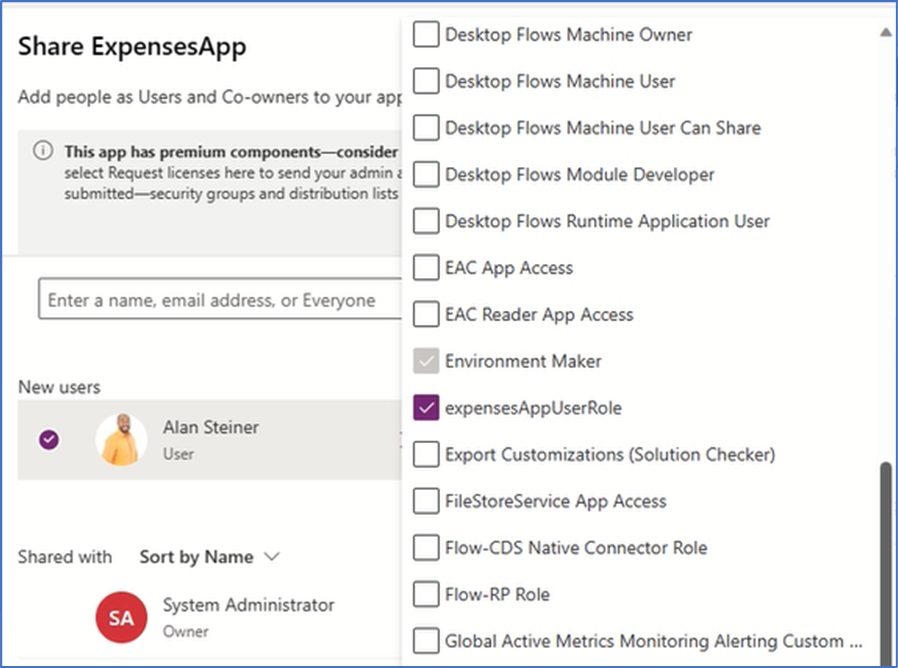
This app leverages the power of Dataverse 💪. As such, to ensure other users only see their data when sharing this app, you’ll need to create a Custom Security Role with User level access to all the Custom tables in the solution: ExpenseHistory, Items, Savings, SettingExpenses, Type Expense & Wishlist: Once you create it, make sure to assign it to the users you are sharing the app with: And any new users the app is shared with should follow the Import default data steps above as well.
⚠️Important final notes & final considerations
System administrator/Global administrator role
A "small" observation when using the application with administrator roles that grant full privileges over Dataverse such as System and Global administrators: As an individual with any of these roles you should not have any issues as long as only you are using the app. However and if the app is shared with multiple users, as a Dataverse admin of any kind, you would be able to see records from others, as well, which would make difficult to track your own, here are the privileges for admin accounts:


You could workaround this issue by either creating your own custom System Admin Role or make sure to use the app with an account without any of these roles, unless only you are using it.

Licenses needed
As the app uses Dataverse as its data source, a Premium [Standalone] PowerApps license would be necessary to run it. Why in the name of God did I choose Dataverse you wonder? Well, not only it easily integrates with PowerApps, taking advantage of delegation and other features, but I would eventually like to [And once with enough records] conduct do some data analysis using Power BI as well, a template I might submit later in the future, if I ever get to it!


Leave a comment